How to measure the impact of design


Organizations are only measuring the user experience at a superficial level - NPS for example. It's easy, it relates to design, it can be quantified, but we know that there's a depth to it that is not being captured. This means that gathering design impacts is often reactionary, with designers scrambling to justify decisions or use indirect measurements as a proxy for their team's work instead of being planned ahead and instrumented in code, like other product metrics. If we want to measure the impact of design it is manual and expensive, so rarely done.
From the product perspective this leads to reactive decision making. From the team perspective, you're never going to have enough researchers, your budgets are never going to be big enough, you're never going to have enough designers and you're going to have to save your budgets for studies that are deemed as “truly important insights”.
Finally, when measuring is not well integrated into the tools and practices and systems, it creates burnout. Researchers and designers will often find themselves reproving the same point, or the effort of measuring usability might get wasted and gather dust in some sort of drive or a slide deck presentation. This leads to attrition, this leads to apathy, and it leads to burnout.
Measuring Data Challenges
- Measuring quality is hard: it requires new skill sets as well as the creation of new roles
- Technology is going to become more complex and integrated. As designers, we'll need to question how our design systems and tools feed into this
- Design already digitises faster than we can measure: we need to understand how to automate the measurement of design quality

Most frameworks are missing design centric data requirements. And so they're not well integrated into development practices. So, even how usability factors relate to each other is often left to subjective means of understanding or ad hoc guesses.
Measuring Design Quality
Measuring quality is nuanced. There's a difference between subjective and objective measures of quality. However, both can be measured with the same category lenses using the three steps of defining factors, criteria and finally metrics.
Factors

For example, you can determine the design factors that make up quality. We're all familiar with the big three of efficiency, effectiveness and satisfaction. But over the years, other factors have become dominant in the field, such as trustworthiness and safety, both data safety and physical safety.
Criteria
Next, each factor can be broken down into criteria. What is efficiency composed of? When things are efficient, they're understandable, they make really good use of your time, their operations are perform easily and their resources are optimised.
Let's take understandability as an example. It refers to how capable a product or a software programme is in giving clear instructions and support. Breaking this down into criteria, we can ask some of the following questions:
- Do our components have the right micro-copy?
- Can we measure how many times someone has clicked on a help link?
These immediately draw distinctions between a qualitative state of something being understandable where, you know, the user is saying, yes, I understand what you need me to do. And it actually becomes a back end indicator that your researchers can use before there is actually a problem. It is the red light signal that tells you, look here, there might be an issue.
So as you define the design factor and the subset of criteria, you start to create a matrix. You can see at a glance the product characteristics that are important to how you evaluate the interface. You can identify overlapping areas. Now, these are just some of the outlines. Breaking down all 10 categories creates about 100 plus combinations, but you can see where there is overlap. What could we measure once that actually encompasses more than one design factor?

Metrics
Criteria like time and productivity or learning, they are made up of something. They don't just exist in a qualitative state. What becomes an abstract concept can then become a logical sequence of operations that is used to quantify a quality attribute. You have to define the numeric value. That's the next step. For example, one of the functions of time is Minimal action. How do you define minimal action? Criteria could include task time, where the metric is the average time for users to move through a product funnel.
This moves you from qualitative to quantitative research because once you've defined your design factors and the subset of criteria, you start to create a matrix and identify overlapping areas, and then grade them by importance.

While this may seem daunting, keep in mind that it's really no different than how design leaders and design teams have broken down the compilation of design systems into digestible qualities for our products teams. We do it all the time. But we use words like atoms and molecules, instead of metrics, criteria and factors. But it's the same in a design system which we're familiar with.
Gathering Data
This is where the fun part starts, if you think data is fun. Most of this data will exist in some shape or form, it just won't exist in the same place. It might be in a business format or lost maybe within a monthly operational review. This is where your quantitative researchers, your data analysts, or your statistician become your best friends. They swim and live and breathe in this data every day. So partner with them.
If you, as the designer, know the insights that tell you the experience quality, and you can articulate the specific dimensions of information that you need to your product person, you can find the information.
So, what started out as sort of like a mad game of find a needle in a burning haystack that's somehow also in space, turns into a more logical approach of a gap analysis.
Applying Data Challenges
All data needs to be taken with a grain of salt because context is important. How humans are using this really matters because usability without context of use is meaningless and design without the context of humanity is useless.
As humans, we want to know things. We are drawn towards numbers we want to quantify our experience we want to know. Unfortunately applying data to design comes with the same challenge inherent in any data task. It is often booby-trapped with four false beliefs about data.
The four McNamara data fallacies to be aware of is are:
We measure first whatever is easiest.
That's ok in itself as long as you don't stop there and continue to tackle the more unobtainable metrics.
We either disregard what isn't easy to measure
Or attribute a random value to it.
We think that if it's too difficult to measure it isn't important.
Mental wellbeing is incredibly difficult to quantify; that doesn't mean it's not important.
If it isn't easy to measure, it doesn't exist
As always you need to dig a little deeper.

The benefits of measuring data quality
Let's talk about money. Measuring design's impact accurately reduces the cost of usability testing, if we provide a consistent basis for understanding and comparing different usability metrics at scale. For example, I insisted that the product team develop and track time on task, completion rate and throughput. By doing this, we reduced the lead researcher's time to provide a benchmark report down from two weeks to only half a day.
It also highlighted a problem. The lead researcher was able to prove that even though the NPS was really high, in the 40s or something, the usability quality was really low. There was a whole population of people who were not taking that survey and having a very bad time with the product itself. When we implemented the design changes, the time on task went down from three minutes to 30 seconds, and the development team could see it - they didn't need research to come in and do another study and prove it.
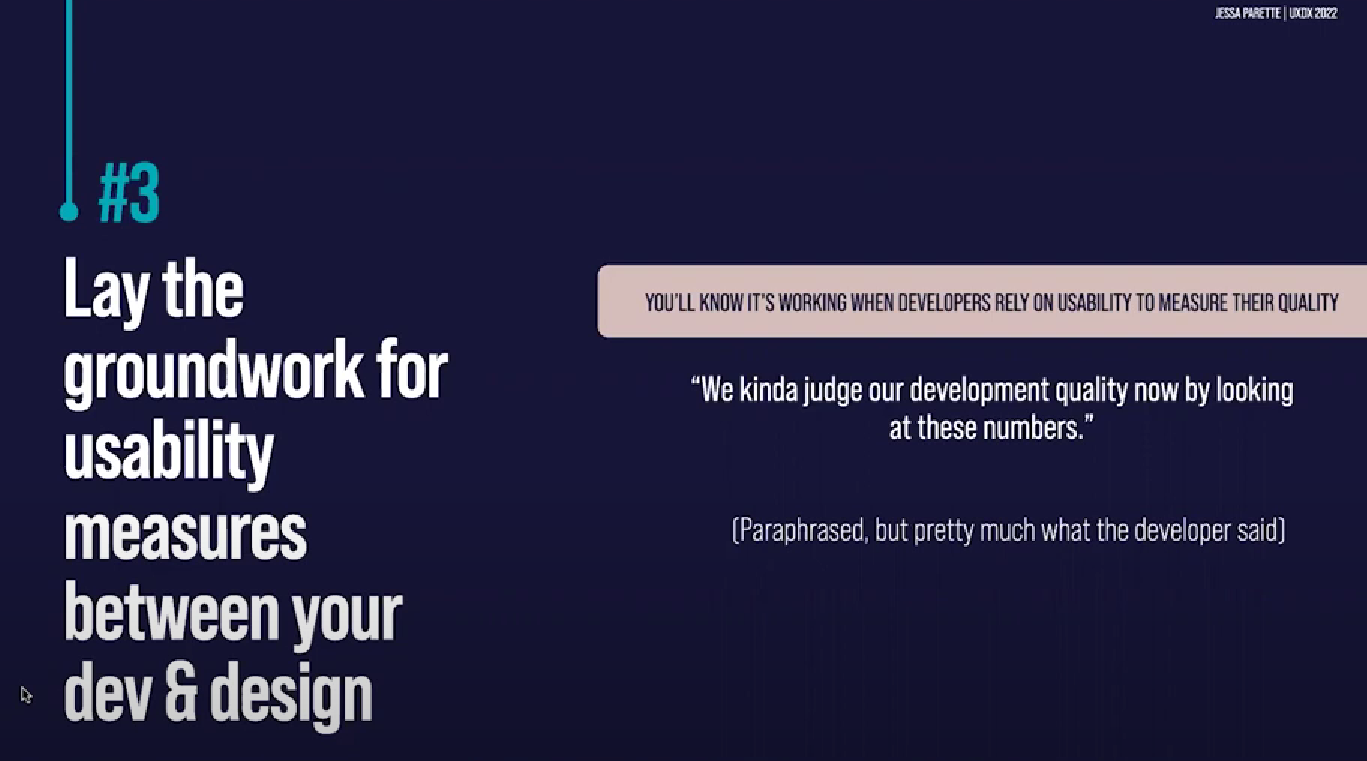
Democratizing usability measurement also creates a foundation of consistent measures that are part of telemetry and instrumentation. Engineering, design, research, and product can all gather and rally around a common understanding. You can demystify what we need to talk about usability quality, they have clear connections.
One of the developers said “you know, our usability measures have become the basis for how we understand if we've developed what design has given us”.

Jessa Parette
Senior Director of Design Strategy, Research & SystemsCapital One
As a design and research leader, Jessa Parette seeks to build intentional experiences and visionary teams. Her career expands over several industries including banking, retail, nonprofits and higher education. Jessa worked her way from an entry level designer to becoming the youngest Head of Design for all of Walmart’s associate digital experience, leading both design and research for national and international products. In her current position as Head of Design Strategy, Systems and Research for Capital One’s auto finance, she builds and leads teams to change banking for good.
Get latest articles straight to your inbox
A weekly list of the latest news across Product, UX, Design and Dev.