How to Measure Efficiency in Software Development


People who work on software projects know the issues that time and cost metrics impose on delivery. I covered a better way of governing software development before but this time I wanted to look at it from an accounting perspective instead of the IT perspective.
Let's start with Manufacturing
How to measure efficiency was a question that plagued the manufacturing industry years before IT software development became mainstream. But rather than discuss the theory of efficiency directly let’s work through an example from the automobile industry. This might seem unrelated to IT but a lot of the efficiency improvements modern product teams are adopting today have been borrowed directly from lean manufacturing principles.
Auto Industry: Stagnating Productivity
The U.S. car industry used to dominate the global market from the time of Henry Ford’s original assembly line until the 1950s.

After World War 2 the Japanese automotive industry really took off. They moved from being perceived as producing low quality, inferior products to displacing the U.S. car companies as the leading suppliers in the U.S. They were able to achieve this by increasing productivity while improving quality. The U.S. companies were not able to match these productivity improvements. The difference wasn’t due to lack of investment; there were plenty of efficiency and improvement initiatives being attempted by the U.S. firms. So how did the Japanese companies deliver such better returns? It came down to their views on how to measure efficiency.
How to measure efficiency
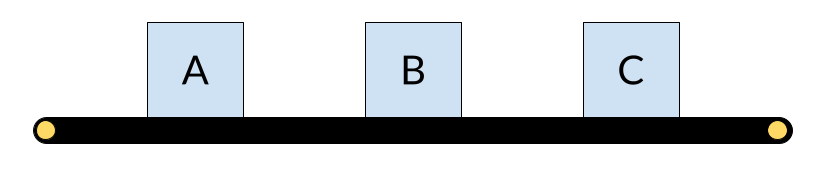
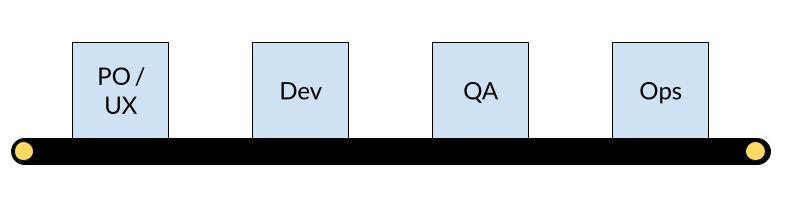
We’ll use this simple assembly line to illustrate the point. We will refer to A, B and C as workstations. In manufacturing, these would be machines that press or manipulate inventory turning it into the finished product.
Cost Accounting
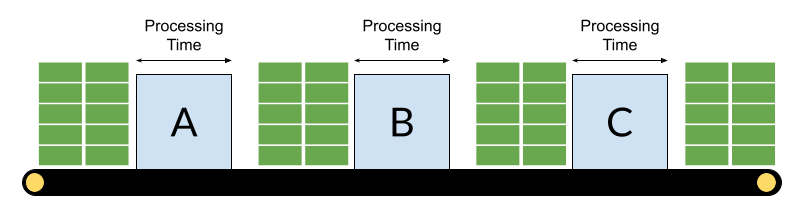
The U.S. firms used cost accounting methods to manage their optimisation initiatives. In cost accounting, teams focus on the costs incurred in producing the goods that were sold in a particular period. A simple way of reducing the cost per product is to ensure near 100% utilisation of the expensive manufacturing machines at each workstation. Automotive factories often produce more than one model of car so the machines need to be able to process multiple variations of a particular item - think about the slight differences between car models. A machine cannot be in use when its configuration is being updated so changing the settings goes against the goal of 100% utilisation. To keep efficiencies high teams would minimise the configuration changes. Another way of looking at it is to say that the larger you can make the batch sizes of each variation produced the greater the efficiency at each machine. And this was the basis for the U.S. car company efficiency drives.
This seems like a pragmatic approach, in theory. In practice, though, things don’t work out as planned. There are three key flaws with this approach:
- Variability and high utilisation lead to delays
- Big batches amplify problems
- Cash Flow
Variability and High Utilisation
There is always variability in the real world. Variability can take the form of:
- demand variability - different car models will have different demand levels
- timeline variability - rush orders will be required to fulfil a contractual obligation
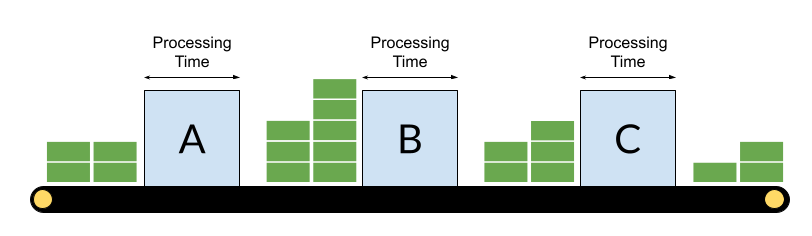
- capacity variability - it is very unlikely that each workstation will be able to process the perfect amount of parts to lead to an exact batch size at the following workstation
- processing time variability - different workstations will work at different speeds meaning that downtime may occur at downstream workstations
- Murphy’s law - problems happen, such as faulty inventory, quality defects and system malfunctions
A certain amount of variability can be managed but to be able to react to variability there needs to be redundancy in the system. If a system has been designed to have 100% utilisation at every stage then there is no excess capacity to manage the variability. In fact, delays due to variability increase exponentially the closer a system gets to 100% utilisation. The result is the constant firefighting we see in many IT teams.
Amplifying Problems
When working with large batch sizes any problems that occur become amplified. Any delay due to variability results in a delay of all of the batches working through the system. In addition, with a large batch, it takes longer for each piece to work its way through the entire system. If a flaw is found later in the process, such as a door hinge that doesn’t fit, a lot of doors will already have been produced. There is a general rule in manufacturing and IT that the quicker you find a problem the cheaper it is to fix. Big batches delay problem identification and therefore make their fixes more expensive.
Cash Flow
Companies need cash flow, as well as profit, to survive - many profitable companies have gone bankrupt because they didn’t have the cash flow to pay bills. Large batches of inventory trap both the material and labour costs in the system for a long period of time until the end products are sold. Unfortunately, cost accounting only factors in the products that are sold in a period which means that there is no disincentive to over produce. If you are being graded based on machine utilisation you are incentivised to do large batches and over produce - both of which work against cash flow optimisation.
So while workstation utilisation seems like a sensible approach for efficiency optimisation there are a lot of factors that limit its effectiveness. This is why the efficiency initiatives in the U.S. car companies failed to deliver on the expected productivity improvements.
Throughput Accounting
Toyota looked at the problem differently. They started with a simple question: how do you define value? Toyota looked at the Return on Investment for all of the labour and material costs. This led them to choose the efficiency of the system as a whole as their metric instead of the efficiency of each workstation. They called this throughput efficiency.
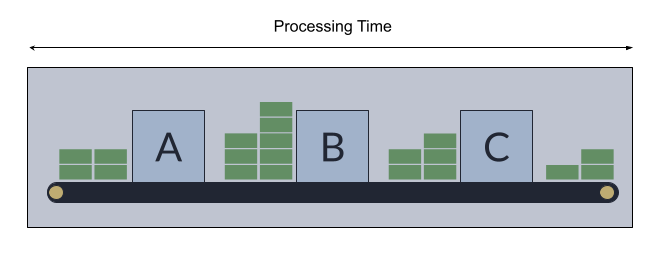
All of the same challenges around variability exist for the Japanese manufacturers as well. But by looking at the system level you have to explicitly factor variability into the design rather than ignoring it for the simplicity of individual workstation efficiencies. This might seem overwhelming because you need to think of the knock on effects of each change. There is a way to direct the efficiency efforts though. Using the Theory of Constraints teams can identify the bottlenecks in their process to help them to identify where to focus their efficiency efforts.
How does this apply to product development?
That was a long sidebar into the manufacturing industry but I think there are a lot of transferable lessons that can be learned. The concept of an assembly line is actually very similar to how work flows through product teams.
As stated at the start, most companies measure efficiency in time and cost. In order to be able to come up with the estimates for time and cost a project manager will add up the estimate that each workstation will make on how long it will take them to do their bit of the full project (big batch). The focus is on the workstations and not on the work being done. If you asked anyone in the teams they wouldn't know what cost accounting is but the focus on time and cost leads teams to optimise around the workstations and not the throughput.
How should teams measure efficiency?
Product teams need to focus on throughput to achieve the same efficiency gains that the Japanese car manufacturers achieved. Fortunately, there has been a lot of research into the best throughput metrics for teams. Nicole Forsgren wrote the book Accelerate with Jez Humble and Gene Kim which introduced four key metrics:
- Lead Time - how long does it take from when a customer asks for something until they have it
- Release Frequency - how often are you releasing code to customers
- Failure Rate - what percentage of releases cause problems
- Mean Time to Recovery - how quickly can you recover from a failure
Why these metrics?
Lead time - this is a measure of business agility. How quickly can you respond to customer needs and changes in the market? Customer expectations are shifting rapidly - what was a delighter a year ago is an expectation this year. Being able to react quickly is critical for long term survival.
Release Frequency - this is a measure of IT maturity. To release quickly you need to invest heavily in automation of testing and deployment. In addition, it also encourages best practices in software development such as TDD or feature flags, which among other things, encourage better designed code.
Failure Rate - speed cannot be achieved at the expense of quality. Failure rate is a counter measure to ensure that teams are not skipping testing.
Mean Time to Recovery - problems will always occur but being ready to respond is critical. Blue-green deployments or feature flags, coupled with business and technology monitoring enable high speed issue identification and recovery.
Common Pitfalls
Lead Time
- Some companies want to use cycle time - time taken from when the request starts being worked on until it is delivered to customers. The argument is that they don't have control over business prioritisation. From the customers perspective they don't care how the company is structured internally - they are still waiting. Lead time will actually highlight the problem leading to better product and IT integration.
- Removing bank holidays, weekends etc. Again customers are waiting on those days. You need to count the total elapsed time.
Release Frequency
- Some companies count project releases instead of code releases because it is hard to release code so they bundle lots of projects together to bump the stats. This actually has a negative effect since bigger releases are riskier. The goal is to solve the problem of difficult releases and not to just paper around them.
Failure Rate
- This can have a negative effect on teams as they might insist on longer testing cycles to reduce risk for releases. Ryanair introduced a rule that if you recovered within 5 minutes it didn't count as a failure. This reduced the fear in teams but also led to teams implemented feature flags to be able to quickly toggle features on and off which had the knock on effect of enabling testing in production.
Mean Time to Recover
- Roll backs are just as valid as rolling forward. As long as customers are back in business it doesn't matter.
What's next?
Listing metrics is the easy part. Implementing them is tough. Time and cost metrics are built into how companies fund work. Also, teams are often structured by functions whereas lead time needs cross functional collaboration. And that collaboration requires a change in reporting lines and how goals are set for individuals and teams. It can seem overwhelming so I would suggest adding the new metrics in addition to time and cost for a few months and use them to highlight where the biggest problems are in your process. The transparency will lead to greater trust in surrounding functions which will lead to more leeway to make changes. Best of luck!

Rory Madden
FounderUXDX
I hate "It depends"! Organisations are complex but I believe that if you resort to it depends it means that you haven't explained it properly or you don't understand it. Having run UXDX for over 6 years I am using the knowledge from hundreds of case studies to create the UXDX model - an opinionated, principle-driven model that will help organisations change their ways of working without "It depends".
Get latest articles straight to your inbox
A weekly list of the latest news across Product, UX, Design and Dev.