Sometimes the Best Chart Is No Chart: Designing Data Visualization for Generative AI


Ask an AI chatbot about your sleep and you will usually get a wall of text. As Kent Eisenhuth, Staff Product Designer at Waymo, put it in his UXDX USA 2026 talk, chatbots are “fairly verbose. They like to talk. They like to produce a lot of text.”
Charts seem like an obvious solution. But Kent’s research found something more interesting: sometimes adding a chart actually made an insight harder to understand.
During his time with the Google Fitbit team, now Google Health, Kent explored when visualisations improve AI-generated responses, when they do not, and what product teams need to understand before deciding either way. The work resulted in eight guiding principles and a reminder that the classic user-centred design process matters just as much in the age of AI.
Why a picture beats a paragraph
Kent opened with a simple test. A slide packed with zeros and ones asked the audience how many times the number 11 appeared. It was slow work. Then he changed the typography, colour and highlights, and the five instances of 11 became immediately visible.
The reason is pre-attentive processing. Humans are good at spotting trends, patterns and outliers quickly. Visual variables such as size, fill, border, shape, weight and colour can reveal something in a dataset much faster than reading through the same information as text.
Kent applied this to a question about his own sleep trend. A visual response showed the falling sleep score, individual measurements and annotated highs and lows, giving him a more useful view of what was happening than the text response alone.
But the goal was not to let people ask a chatbot to draw charts. People would ask normal questions about their health, and the product would decide if, when and how a visual should appear. The goal was better comprehension, engagement and delight.
Start with the question, not the chart
Before choosing a visualisation, the team needed to understand what people actually wanted to know.
More than 2,000 participants were asked what they would ask a fitness chatbot. The team grouped those questions by intent and found three broad types: trends, personal bests and worsts, and correlations between metrics.
Those distinctions mattered. “Is my sleep getting better?” is a different problem from “Did yesterday’s activity affect last night’s sleep?” or “Has six weeks of this workout plan changed my resting heart rate?”
Only after understanding the insight did the team think about how to represent it.
For trends, they expected line charts to work well because slopes are easy to interpret and, unlike bars, the axis does not always need to begin at zero. A study with more than 600 participants supported that choice.
“Think about the insight first, and then everything else will follow from that.”
— Kent Eisenhuth, Staff Product Designer, Waymo
Sometimes the best chart is no chart
Then the research produced a result the team did not expect.
For correlations, they tested punch cards, heat maps, scatter charts, multiple line charts and different placements within the AI response. Every study also included a text-only control.
The text-only response performed dramatically better for comprehension than any of the charts.
“We blew it,” was the team’s initial reaction.
Instead of abandoning visualisation, they went back to the underlying problem. If traditional charts were not helping, could another kind of visual?
They created an infographic using typography and iconography rather than a conventional chart. Tested with another 2,100 participants, it dramatically outperformed the text-only response.
The AI model then added a new problem. Sometimes the infographic listed its points in the reverse order of the text response, so the two looked like opposing insights when they were telling the same story. Because the research had given the team confidence in the design direction, they could use it to convince engineering and leadership to invest in fixing the issue.
The lesson was not that charts were bad. It was that the form has to follow the insight. A visualisation only earns its place if it actually helps people understand what the data is saying.
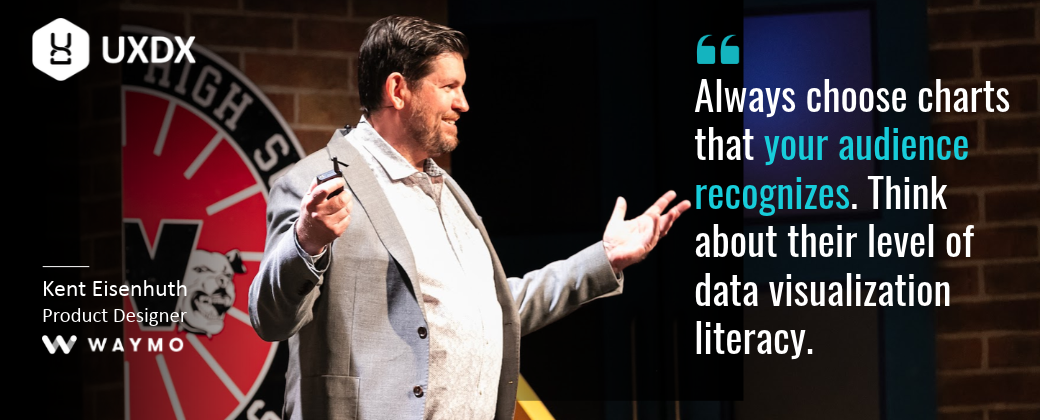
Use what your audience understands
The team saw the same principle elsewhere.
Before choosing more sophisticated visualisations, they checked whether familiar charts added value at all. In a study with more than 2,100 participants, adding a bar chart to an insight increased comprehension by 30%.
But more technical visualisations did not perform as well. Scatter charts were difficult for this consumer audience to interpret, while familiar metaphors such as calendars worked much better.
Guide people, then let them explore
A chart can show the data without necessarily helping someone understand it.
Kent used a bumpy step-count line as an example. Left alone, it requires the customer to work out what matters. Add highlights, inline labels, annotations and simple calculations, and the product can guide attention towards the useful parts.
The question of what to highlight can come directly from the customer. As Kent put it, “What’s interesting to them is the very questions they’re asking of the product.”
But not everyone wants the same level of detail.
The team used Bart and Lisa Simpson as shorthand for two behaviours. Bart wants a quick summary and moves on. Lisa wants the data behind the claim.
The audience was almost evenly split, at 48% Bart and 52% Lisa. More importantly, 88% wanted the ability to explore the data further.
That led the team to make charts interactive, allowing people to tap individual data points. Their experiments suggested that a simple, guided view can work as the entry point, with more complex information available when someone wants to go deeper.
Don’t flatten the data
Simplicity can also go too far.
Visual designers often reduce complex datasets to a single clean line or bar chart. Kent questioned whether that always gives people a responsible view of their data.
His example used 26 weeks of sleep data, with one line for each week. Patterns emerged that would disappear in a more aggressively simplified view: better sleep at weekends, a dip on Sunday nights and other variations over time.
Instead of stripping those details away, the design can preserve them and highlight the parts relevant to the question being asked.
The goal is not maximum simplicity. It is making complexity understandable without pretending it is not there.
Craft still matters
Kent also argued that generated content makes attention to detail more important, not less. He expects attention to detail, originality and authenticity to be what separates great products from the “AI slop” that will be everywhere.
His example was the Google DeepMind short film Dear Upstairs Neighbors. Former Pixar animators used generative AI, but the result did not come from simply prompting a model and accepting its first output. The team spent significant time refining the model around an original visual style.
Kent’s team took a similar approach to Fitbit’s visualisations. They considered what would make the charts recognisably Google, using expressive curves and gestural treatments where appropriate and more technical treatments for areas such as lab metrics.
Even small details mattered, such as the spacing of dots in heart-zone threshold lines. Accessibility came first too, with designs that did not rely on colour alone to communicate meaning.
The point was not decoration. If AI is going to generate parts of the experience, the system still needs clear design decisions about what good looks like.
What happens when the research says no
The Q&A returned repeatedly to the role of testing.
When an idea failed, the team did not treat that as a reason to abandon the problem. The correlation study led them back to basics and eventually to around 90 different infographic concepts.
For larger questions, they combined moderated and unmoderated research, increasing sample sizes where they needed greater confidence.
Kent was also asked how much an AI needs to be taught about which charts to use. Models are only as good as their training data, he said, and many designers were never formally trained in chart selection. In the Google-wide data viz office hours he took part in from 2021 to 2023, “which is the right chart to use?” kept coming up. So the team applied what they knew to train a model, because, as Kent put it, “I wouldn’t necessarily look to a model right away to figure this out.”
They also measured more than preference. One important metric was comprehension: after the insight disappeared, what did people actually remember?
That matters when designing AI experiences because a plausible answer is not enough. Teams need evidence that people can understand and use what the system produces.
Building for people, not machines
Of Kent’s eight principles, one sits underneath all the others: remember we’re building for people and not machines.
“It’s easy to get caught up in the glitz and the glamour of the technology and get intoxicated by the possibilities of AI. But we’re here to create meaningful experiences for people at the end of the day.”
— Kent Eisenhuth, Staff Product Designer, Waymo
That means starting with real questions, choosing forms people understand, testing assumptions that feel obvious, preserving the complexity that matters and paying attention to the craft of the final experience.
The lesson from Kent’s work is not that generative AI needs more charts.
It is that every representation has to earn its place.
Sometimes that is a line chart. Sometimes it is an interactive visualisation. Sometimes it is typography and icons.
And sometimes the best chart is no chart at all.
Want to watch the full talk?
You can find the full talk here:
https://uxdx.com/session/data-visualization-generative-ai-human-centered-principles-for-building-genai-data-experiences/
Or explore all the insights in the UXDX USA 2026 Post Show Report:
https://uxdx.com/post-show-report/

Rory Madden
FounderUXDX
I hate "It depends"! Organisations are complex but I believe that if you resort to it depends it means that you haven't explained it properly or you don't understand it. Having run UXDX for over 6 years I am using the knowledge from hundreds of case studies to create the UXDX model - an opinionated, principle-driven model that will help organisations change their ways of working without "It depends".
Get latest articles straight to your inbox
A weekly list of the latest news across Product, UX, Design and Dev.